The Power of Data: Manufacturing Organizations turning into Smart Factories

[clear by=”60px” id=”” class=””][text]

smart factories, decision-making, data analytics, data-driven, intelligent automation

[/text][custom_heading id=”” class=”” style=””]

The Power of Data: Manufacturing Organizations turning into Smart Factories

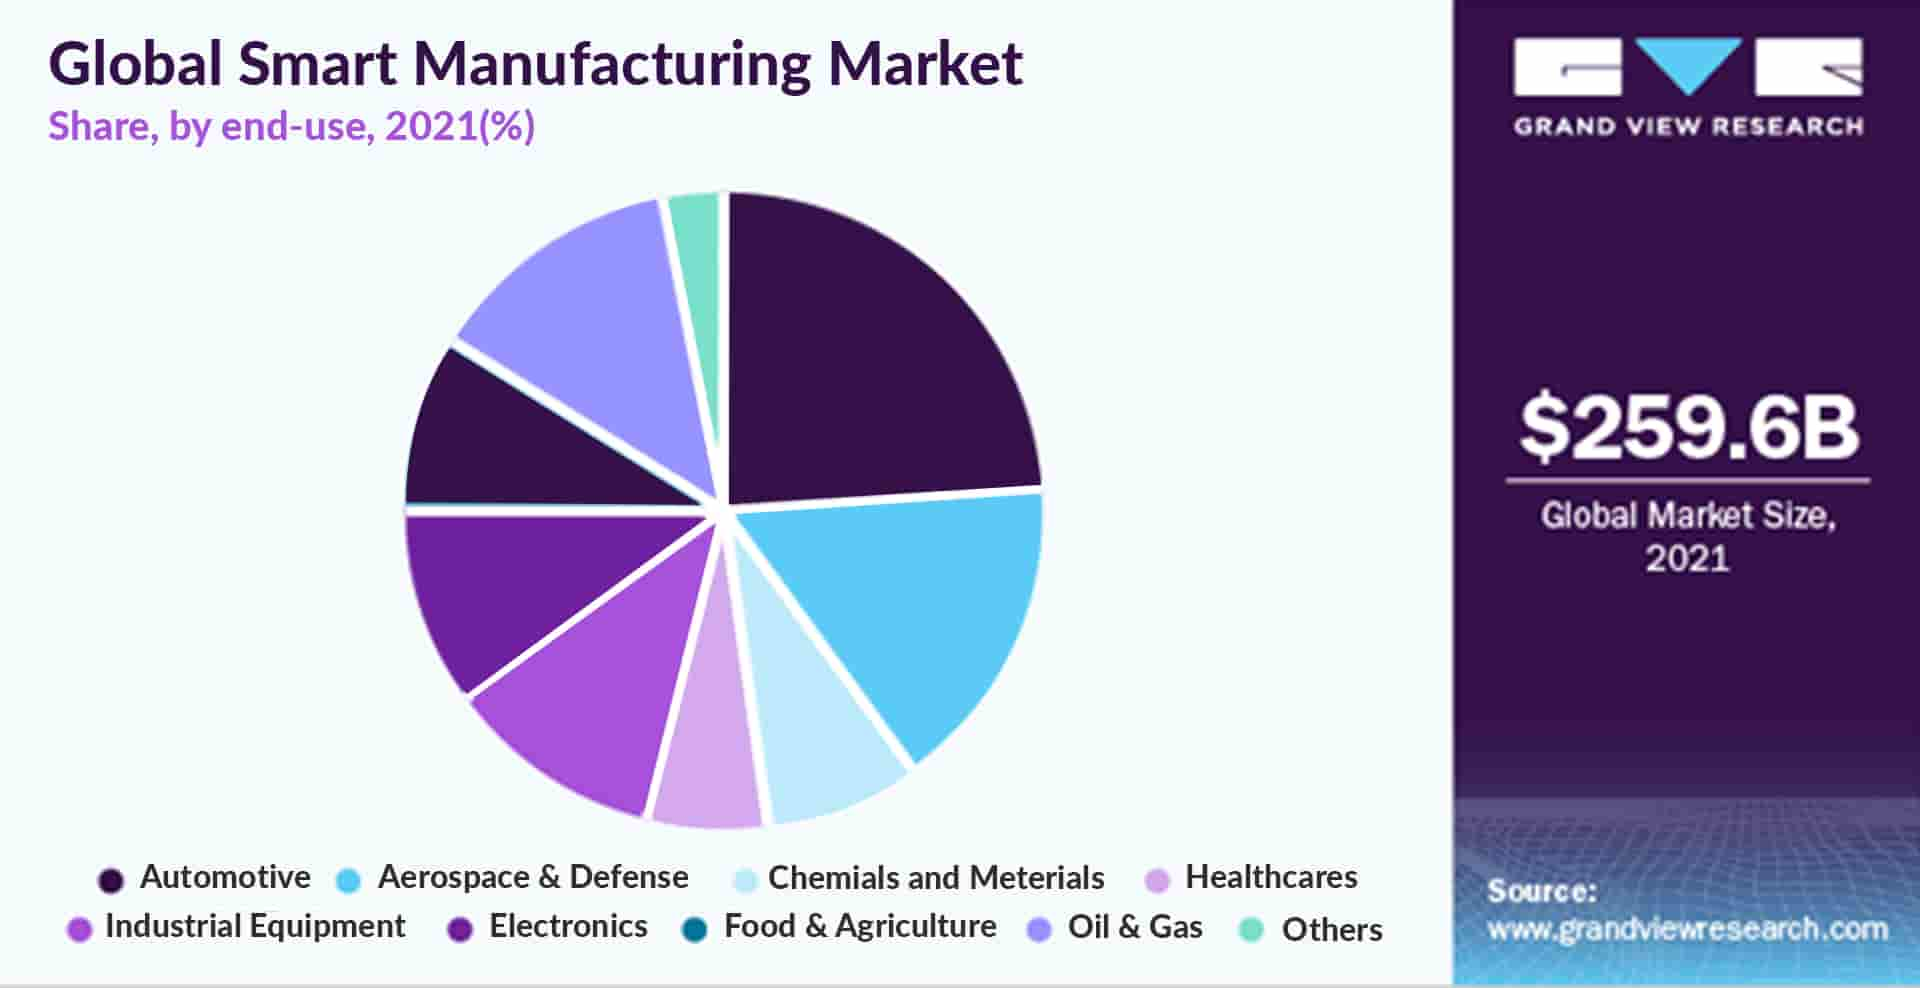
[/custom_heading][share facebook=”true” twitter=”true” linkedin=”true” email=”true” size=”small” id=”” class=”” style=”margin-top: 10px;”][clear by=”15px” id=”” class=””][text]“The global smart manufacturing market is expected to grow from USD 277.81 billion in 2022 to USD 658.41 billion in 2029 at a CAGR of 13.1% during the 2022-2029 period.”

– Fortune business Insight

[/text]
[image lightbox=”” width=”” is_gallert_item=”” src=”17238″ alt=”” href=”” title=”” popup_content=”” id=”” class=”” style=””]

The power of Data, AI, automation and Analytics can enable manufacturers to increase productivity of their business by providing insightful predictions for better decision making and enabling intelligent automation.

Smart factories can monitor an entire organizations processes, from sales and product design down to the individual operators on the floor and support. Smart factories are powered to get a comprehensive view of all processes, which leads to faster response times, stronger decision-making capabilities, and fewer delays.

[custom_heading id=”” class=”” style=””]

Data is the key to ‘Smart Factories’

[/custom_heading][text]

When data is entered and managed manually, it is inconsistent and has missing value to support improvements in the manufacturing processes.

Sensor Data Gathering: Digital sensors installed on sensor-rich machines have enabled faster real-time data availability from factory floors. The availability of high-quality, high-value data enables the vision for “Smart factories of the future”, characterized by timely scheduling of tasks and pro-active actions. Process insights from manufacturing plant floors for all operations have opened doors for real-time surveillance, operational optimization, and adaptive controls.[/text]
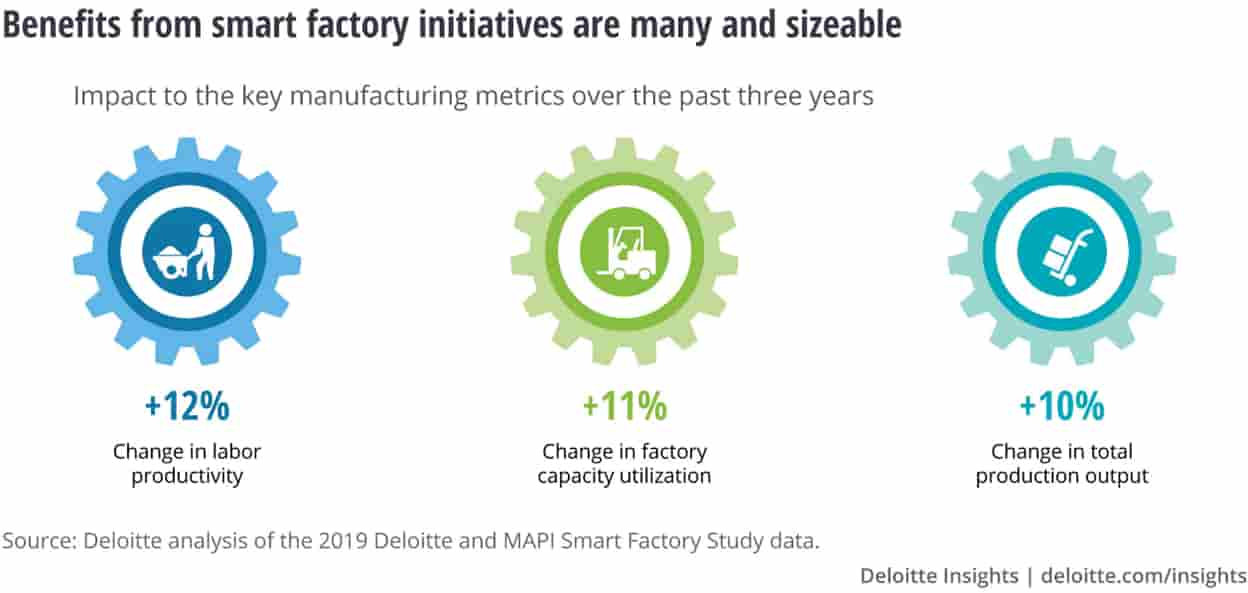
Cloud Enablement for Data Storage and Computing: Advancements in computational infrastructure, represented by cloud and edge computing, have made it feasible to manage big data. This supports tasks of different temporal requirements, from process control to production schedules. The emergence of distributed production has transformed the traditionally centralized factories into a more service-oriented, individualized manufacturing resource.

McKinsey has predicted that data will play a central role in intelligent manufacturing, with key technologies including

  • Automated in-plant logistics
  • Data collection across supply chain
  • Data-driven predictive maintenance
  • Automation and human-machine collaboration
  • Digitalized quality system and process control,
  • Digital performance management
  • Smart planning and agile operations.
[clear by=”20px” id=”” class=””][custom_heading id=”” class=”” style=””]

Data to enable better Decision Making

[/custom_heading][text]

By digitally integrating an organizations’ current systems and harnessing data, companies are in a position to develop and refine areas like lean manufacturing and workforce management. It allows organizations to explore new ways of optimizing operations, driving higher productivity, and harnessing talent.

Understanding Managerial Decisions Amidst Uncertainty – Data analytics allows leaders to reinforce decisions through a process of iterative, evidence-based decisions. Educating executives can help reduce the knowledge gap by marrying traditional data analytics with management thinking and decision-making.

Once a data mindset is adopted, the next step is putting that insight into action and building the infrastructure in the organization to make good use of the available data. At its core, being exposed to data analytics, new analytics tools, and new ways to think about data can change how we approach problems and solutions.[/text]

[clear by=”20px” id=”” class=””][custom_heading id=”” class=”” style=””]

Data to Understand Customer Needs and Product Quality

[/custom_heading]

[clear by=”20px” id=”” class=””][text]

The success of IR 4.0 and IoT technologies for the manufacturing industry depends on digitalization, Data + AI + Analytics technologies. It can enable decisions on logistics, risk estimation, cost structures, growth strategies, quality control and improvements, built-to-order and other sales models, and post-sales services.

Manufacturers use data analytics to forecast customers’ needs for products. User data collected includes demographics, purchase patterns, user preferences, search history, browsing history, and more.

While this is a relatively new method of analyzing information, big data can now be used to understand consumer behaviour, which in turn can help improve customer satisfaction. Consumer behaviour knowledge leads to better promotions and target products, increasing sales, improving, and optimizing customer experience.

[/text]

[image lightbox=”” width=”” is_gallert_item=”” src=”17242″ alt=”” href=”” title=”” popup_content=”” id=”” class=”” style=””][clear by=”15px” id=”” class=””]
[clear by=”20px” id=”” class=””][text]Focus on Product Quality

Data-driven quality control techniques make a stronger platform to manage quality efficiently. With sensors, RFIDs, and machine-based applications at their disposal, manufacturers can now collect product quality data, such as various parameters, including location, machining, tolerance, and geometrics.

Computer vision can perform all-round quality monitoring, detect defects early, and provide a quick diagnosis. The data gathered can also be used to identify the root cause of product production failures. Using the latest technology, defects can be detected, diagnosed, and addressed before shipment reducing returns/refunds. Using data mining and data integration issues with equipment and inefficient procedures can also be detected.

[/text]

[clear by=”20px” id=”” class=””][custom_heading id=”” class=”” style=””]

Data to Increase Overall Equipment Efficiency (OEE)

[/custom_heading][text]

OEE, or Overall Equipment Efficiency, a measure of performance, can be broken into three parts: Quality, Productivity, and Availability. As the single most important measure of production measuring KPI: what proportion of the operational time a facility has been productive.

A smart factory uses cloud-based data analytics, AI/ML models, and Automation capabilities to speed up efficiency programs. With technologies such as, IoT, ML, and analytics, companies can build a hyper-connected production ecosystem powered by data to identify, predict, and avoid unplanned downtimes, from equipment malfunctions to quality issues.[/text]

[clear by=”20px” id=”” class=””][custom_heading id=”” class=”” style=””]

Data to Enable Intelligent Automation

[/custom_heading][text]Predictions made by Gartner indicate, “By 2025, more than 90% of enterprises will have an automation architect, up from less than 20% today.”

According to McKinsey, “At its core, Intelligent Process Automation (IPA) is an emerging set of new technologies that combines fundamental process redesign with robotic process automation and machine learning. It is a suite of business-process improvements and next-generation tools that assists the knowledge worker by removing repetitive, replicable, and routine tasks. And it can radically improve customer journeys by simplifying interactions and speeding up processes.”

Manufacturing industries are facing myriad challenges — from reducing downtime and having to meet ever-increasing regulations, to supply chain complexities, and growing skills gaps. Staying ahead of evolving demands in manufacturing is a tall order.

All these challenges have presented an excellent opportunity for manufacturing companies that adopt AI and automation technologies to speed up their journey to digital transformation. AI, Automation, and advanced analytics is helping to present a realistic view of operational efficiencies, workforce costs, and allow better decision-making, thereby transforming the landscape of manufacturing unit.

With digital robots, manufacturers are processing massive amounts of data to optimize order fulfilment, sourcing, scheduling appointments, and alerting. With predictive analytics solutions, maintenance engineers can predict errors and be able to fix them before the equipment is significantly affected. This technology allows for deep inspections of quality, which are far more detailed and robust than those done by humans.[/text]

[clear by=”20px” id=”” class=””][custom_heading id=”” class=”” style=””]

Conclusion:

[/custom_heading][text]

The move towards automated software, connected equipment, and data analytics are being mirrored by manufacturing companies looking to optimize their factory floors through recent technological advances. People + Process + Technology with data when brought together in the right mix can transform a manufacturing unit into a digital enterprise, making them a basis for robust smart factories. As manufacturing companies continue to embrace smart factory technologies, they will enjoy the benefits of maintaining predictive maintenance in their machines, better data stream management, and cost savings across a range of areas.

[/text]

[clear by=”20px” id=”” class=””][text]

Stay In the know

Get latest updates and industry insights every month.

[/text][clear by=”15px” id=”” class=””]

    5 Secrets of Successful Data Led Organizations

    [clear by=”60px” id=”” class=””][text]

    data-driven organization, data-driven, data-driven culture, data analysis, insight driven

    [/text][custom_heading id=”” class=”” style=””]

    5 Secrets of Successful Data Led Organizations

    [/custom_heading][share facebook=”true” twitter=”true” linkedin=”true” email=”true” size=”small” id=”” class=”” style=”margin-top: 10px;”][clear by=”15px” id=”” class=””][text]

    “The benefits of a data-driven culture is to examine and organize the data with the goal of better serving one organization’s customers and consumers,” says Alan Duncan, Vice President Analyst, Gartner. “It also bolsters and speeds up business decision-making processes.”

    Data-driven organizations are known to consistently outperform those that do not, making informed, efficient decisions that increase profitability and reduce costs.

    [/text]

    [image lightbox=”” width=”” is_gallert_item=”” src=”17128″ alt=”” href=”” title=”” popup_content=”” id=”” class=”” style=””]

    Effective data analysis can provide companies with an enormous competitive advantage, as corporate managers are able to get fresh insights about trends and customer behaviors that may otherwise be impossible. Using business-critical, real-time insights to identify key business challenges that impact an organization, which must be addressed, becomes a lot easier when data is on hand.

    Gartner predicts – “By 2023, data literacy will become an explicit and necessary driver of business value, demonstrated by its formal inclusion in over 80% of data and analytics strategies and change management programs.”

    Here are some characteristics that today’s successful data-driven companies have adopted:

    [custom_heading id=”” class=”” style=””]

    Creating a Data Driven Culture

    [/custom_heading][text]

    Every organization has different levels of expertise and people from widely different backgrounds but ultimately all should be united by the same goal. Even though there may be people who will not understand what the others are doing but they should know they are the same team, and that’s where the culture comes in.

    Focus on strategy while building a data driven culture is the need of today’s time. We need to establish a set of practices that brings together data, talent and tools in such a way that data becomes a default backbone of company operations.

    Many times, CEOs tackle data solely from the perspective of a business strategy, but implementing a successful strategy is not possible unless a company’s culture has already bought into the idea of being data-driven.

    To help foster this culture, data needs to stay available, and employees need to feel encouraged to incorporate facts and statistics into their reports, status and information provided at all times.

    [/text]

    [clear by=”20px” id=”” class=””][custom_heading id=”” class=”” style=””]

    Data Accessibility to Everyone

    [/custom_heading][text]

    Next, is making data relevant and available for everyone. Sometimes even the best data-driven companies still reside in silos making the data hard to access.

    Organizations cannot ignore the importance of data-driven culture in today’s accelerating and fast-paced world.

    [/text]

    [clear by=”20px” id=”” class=””][custom_heading id=”” class=”” style=””]

    Leaders Leading by Example

    [/custom_heading]

    [clear by=”20px” id=”” class=””][text]

    Organizations that are data-driven have at the helm strong leadership. It is a leadership that inspires and promotes a data-driven culture. Such leaders make it their priority to provide data, tools, and training to their employees so that they can be data-driven. Leaders of data-driven organizations ensure to garner support from rest of the organization, and the senior management team to deliver results.

    It is one thing to require that your people work with data, but it is quite another to show that you have the ability to drive decision-making and critical thinking using it. When CEOs and other corporate leaders set an example, they are also more likely to make the technology and human capital investments needed to power a data-driven organization.

    Successful business leaders have quickly jumped on the bandwagon and have invested in training and showcasing how data is driving important business decisions.

    [/text]

    [image lightbox=”” width=”” is_gallert_item=”” src=”17130″ alt=”” href=”” title=”” popup_content=”” id=”” class=”” style=””][clear by=”15px” id=”” class=””]
    [clear by=”20px” id=”” class=””][custom_heading id=”” class=”” style=””]

    Creating a Strategy

    [/custom_heading][text]

    A thoughtful strategy is, of course, crucial for the success of almost every enterprise effort, and data initiatives and analytics are no different. However, there are still a number of companies that are yet to achieve their data and analytics goals, and an increasing proportion admits that a lack of a strategy in these areas is a major barrier to success.

    To drive revenue in an organization it is imperative to be data driven as well as insight driven. Implementing a data-driven plan can help businesses make more informed decisions and turn customer insights into profits.

    Businesses that are successfully driving data have identified creating a strategy as the most critical element to meeting their company’s objectives.

    [/text]

    [clear by=”20px” id=”” class=””][custom_heading id=”” class=”” style=””]

    Treating Data as asset that provides ROI

    [/custom_heading][text]

    Business leaders must see data as a raw material to power analytics and decisions. Data should be treated as an important company product that needs to be packaged and distributed among groups throughout the enterprise.

    A product manager’s responsibility to consumers is to build a variety of revenue streams through channels, segments, and markets. In the same way, the owners of each data domain act as product managers for data, and their effectiveness is tied to revenues, satisfaction, quality, and other such measures.

    [/text]

    [clear by=”20px” id=”” class=””][custom_heading id=”” class=”” style=””]

    Conclusion:

    [/custom_heading][text]

    To be data-driven, organizations must rethink their approaches to using data in ways that go beyond technology. Becoming a data-driven organization also requires changes to the culture of the organization, the operating model, and the realization of real business value via use cases. Becoming a data-driven business requires having a coherent, holistic data strategy applied throughout an organization.

    [/text]

    [clear by=”20px” id=”” class=””][text]

    Stay In the know

    Get latest updates and industry insights every month.

    [/text][clear by=”15px” id=”” class=””]

      How can Organizations transform to be Data-Led and Insight driven

      [clear by=”60px” id=”” class=””][text]

      Digital Transformation, Data Led, Insight driven

      [/text][custom_heading id=”” class=”” style=””]

      How can Organizations transform to be Data-Led and Insight driven?

      [/custom_heading][share facebook=”true” twitter=”true” linkedin=”true” email=”true” size=”small” id=”” class=”” style=”margin-top: 10px;”][clear by=”15px” id=”” class=””][text]

      Business leaders of data-driven organizations realize the benefits of leaning from data and insights to make smart business moves. Data-driven organizations derive value from data analytics and the process of analyzing data to gain business insights. An insights-driven organization puts data and analytics front and center in its business strategy and across all levels, with each decision informed by insights gained from data and models.

      [/text]

      [image lightbox=”” width=”” is_gallert_item=”” src=”16233″ alt=”” href=”” title=”” popup_content=”” id=”” class=”” style=””]
      [custom_heading id=”” class=”” style=””]

      Why data, AI, and analytics matter?

      [/custom_heading][text]

      Over the past many years, business strategists have been obsessed with a data-driven mindset. But why does data matter so much? Well, the answer is straightforward: Businesses want to make decisions objectively, remove biases and identify inefficiencies. Data can reveal our habits and what our next action might be. It opens the door of opportunity and brings to the front and center, what’s possible. This idea of leading brings the culture to collect and analyze data for decision-making.

      According to McKinsey, 70% of digital transformation projects fail to meet the stated goals. It means most projects revolving around data are not getting the results they are looking for. More importantly, companies are flooded with mountains of data, with no growth in using this information to inform insights and strategies. There are organizations, though, getting it right.

      Here are a few core principles data-driven organizations are following. These principles are traits and behaviors thriving organizations are following.

      [/text]

      [clear by=”20px” id=”” class=””][custom_heading id=”” class=”” style=””]

      Decide and Plan what to achieve

      [/custom_heading][text]

      Often organizations are anxious to start using all the data they collect. They have gone through the process of ensuring the data is captured, so the next logical step is utilizing it. Companies are measuring everything, and since data is abundant, businesses end up with hundreds of analytics projects designed to measure or describe each facet of an organization.

      If a business challenge (problem) is decided based on business value it can unlock, then it is easy to come up with the questions to which you need to get an answer. The knowledge of datasets can make it easier to choose what data can help in getting an answer to the question.

      [/text]

      [clear by=”20px” id=”” class=””][custom_heading id=”” class=”” style=””]

      Understanding the gaps and issues

      [/custom_heading]

      [clear by=”20px” id=”” class=””][text]

      Along the way, organizations will run into data gaps and quality issues. What is meant by data gaps and data quality deficiencies? This might occur when you have multiple manual processes for a task, or maybe you want to measure something less obvious.

      When gaps and quality issues are revealed, data-driven organizations use this as an opportunity to streamline processes. This can include going back to the source systems and forcing more stringent requirements on the inputs of the data. It could mean building new systems to capture data or defining more explicitly the transformational and rationalizing steps needed before the data becomes useful.

      [/text]

      [image lightbox=”” width=”” is_gallert_item=”” src=”16235″ alt=”” href=”” title=”” popup_content=”” id=”” class=”” style=””][clear by=”15px” id=”” class=””]
      [clear by=”20px” id=”” class=””][custom_heading id=”” class=”” style=””]

      Data Governance

      [/custom_heading][text]

      Once the components for understanding have been put in place, data-driven organizations take the time to determine roles and assign ownership or simply put, establish the Who. A lack of roles and ownership leads to scenarios in which no one knows where the truth lies.

      Data-driven organizations identify the different roles and most importantly, assign each one ownership.

      [/text]

      [clear by=”20px” id=”” class=””][custom_heading id=”” class=”” style=””]

      Best Practices

      [/custom_heading][text]

      Data-driven organizations see every new project as an opportunity to establish best practices, and to use it as a model for how the next project should be approached. Starting with best practices can accelerate future initiatives.

      Having the right data element is critical in making sure the data collected has insight for decision-making. Here are a few best practices:

      • Set clearly defined goals.
      • Enforce data collection from all sources identified.
      • Ensure data is a central point for the organization not just to be used by one department.
      • Inform and educate everyone on how to utilize data assets for decision-making.
      • Collaboration among all departments and groups is essential.

      [/text]

      [clear by=”20px” id=”” class=””][custom_heading id=”” class=”” style=””]

      Measuring utilization and adoption

      [/custom_heading][text]

      As much as companies believe in measuring factors that affect businesses, the importance of measuring analytics usage and adoption also must be considered. Measurement is the key to understanding user behavior, everything from consumption to creation.

      There are plenty of ways these aspects are measured, but these are the three main areas that need to be focused on.

      User Engagement: The goal here is to figure out how well analytics are adopted and how much engagement is happening with users.

      Utilization: The focus is on the insights rather than the platform itself. Here, the focus is on digging deeper to see what things people are looking at and what they are interested in learning and analyzing.

      Performance: It is the balancing act of making sure end users have the experiences they want, getting what they need when they need it. Of course, uptime comes into play here, making sure there is an uninterruptible service, making sure when data is required to make decisions, that data is there. And finally, using normal monitoring techniques for reviewing logs, parsing out alerts from systems, and fixing any hardware failures.[/text]

      [clear by=”20px” id=”” class=””][custom_heading id=”” class=”” style=””]

      Conclusion:

      [/custom_heading][text]

      The principles shared here fall into three stages of an analytics strategy. First is the foundation – the place where the framework is set of what is being measured, where it comes from, how it is going to be rationalized, and who will own, manage and use it. Second is the execution phase, starting from how data-driven organizations use tactics that leave audiences wanting more and backing that up with the knowledge of how to deliver. Finally, in the maintenance stage, where iteration is a mantra of every project, attention is paid to measuring uptake and managing platforms, champions built, and every victory celebrated.

      [/text]

      In the global and fast paced world today where survival is a challenge, the role of intuitions and experience have change reduced from 75% to 25%. Now we need data and skills to drive insights from data to back our intuition and experience. Insights identify inefficiency and vulnerability in processes, operations and product development leading to better and informed decisions. Organizations today need to gather, organize, analyze and represent the data to increase efficiency, reduce cost, target right business problem to solve. We all have a hammer, we need data to know where we need to strike with the hammer.

      Sidharth Mittal

      VP, Account Management

      [clear by=”20px” id=”” class=””][text]

      Stay In the know

      Get latest updates and industry insights every month.

      [/text][clear by=”15px” id=”” class=””]

        NextGen Invent Corporation named on the Inc.5000 2022 List

        "NextGen Invent receives ranking of Top 250 in NY state and #3280 nationally among America’s Fastest-Growing Private Companies"

        [text]

        NEW YORK, August 16, 2022 – Inc magazine announced its Inc.5000 Fastest-Growing Private Companies in America list for 2022 and NextGen Invent Corporation was ranked (https://www.nextgeninvent.com/) in the top 250 in New York State and #3280 nationally. This list represents a one-of-a-kind look at the most rapidly growing companies within the economy’s most dynamic segment: independent businesses.

        “Our success lies in our ability to give a competitive edge to our customers,” stated Deepak Mittal, NextGen Invent CEO. “NextGen Invent is committed to delivering solutions to the toughest of challenges while being truthful to our core values.”

        The Inc. 5000 companies have not only shown success but also continuously driven innovation to create value for its customers, partners, and employees. During a time when nine out of ten startups fail, NextGen Invent has built an ecosystem that includes top industry experts, CXO of fortune 500 companies, and proven best practices to ensure success of organization’s key initiatives.

        Apart from its top-tier technology, AI Enablement, and automation services, NextGen Invent has helped entrepreneurs increase their company valuation, prepare for competition, and define their product and IT strategy. Our clients, who range from fortune 500 companies and start-ups with innovative ideas, have trusted us to bring their innovative products and services to the market. We are enabling them to gain a competitive edge and make data-led decisions.

        “The accomplishment of building one of the fastest-growing companies in the U.S., in light of recent economic roadblocks, cannot be overstated,” says Scott Omelianuk, editor-in-chief of Inc. “Inc. is thrilled to honor the companies that have established themselves through innovation, hard work, and rising to the challenges of today.”

        https://www.inc.com/profile/nextgen-invent-corporation[/text]

        About NextGen Invent Corp

        [text]NextGen Invent (“NGI”) is a leading global professional services company that specializes in providing IT strategy, technology, and data science services. Founded in 2006, NGI has always been at the forefront in providing solutions using cutting-edge technologies such as Artificial Intelligence, Big Data Analytics, IOT, Cognitive Automation, Blockchain, and Mixed Reality. Our in-depth industry knowledge, specialized technology expertise, unmatched data science experience, and global delivery network along with our “Customer first” policy has allowed us to grow via word of mouth. Regardless of what technology you use, you can trust NGI to solve your business problems. Our core service offerings are:

        • Digital Transformation
        • Data + AI + Analytics
        • Product Development
        • IT Strategy


        Learn More at www.nextgeninvent.com/

        Sales Contact: [email protected]

        Media Contact: [email protected]

        About Inc.

        The world’s most trusted business-media brand, Inc. offers entrepreneurs the knowledge, tools, connections, and community to build great companies. Its award-winning multiplatform content reaches more than 50 million people each month across a variety of channels including websites, newsletters, social media, podcasts, and print. Its prestigious Inc. 5000 list, produced every year since 1982, analyzes company data to recognize the fastest-growing privately held businesses in the United States. The global recognition that comes with inclusion in the 5000 gives the founders of the best businesses an opportunity to engage with an exclusive community of their peers, and the credibility that helps them drive sales and recruit talent. The associated Inc. 5000 Conference & Gala is part of a highly acclaimed portfolio of bespoke events produced by Inc. For more information, visit www.inc.com.[/text][text]Deepak Mittal
        Founder and CEO
        [/text]

        13 Practices To Keep Remote Teams Running Smoothly

        "Analyze And Prepare For Future Scenarios."

        [text]

        Post Covid-19, partner, customer and employee needs have changed and will continue to change. Analyze future scenarios and prepare strategic innovative ways to address changing needs in those scenarios. Establishing new partnerships to expand products and services market size. Building a culture to shift resources without friction at light speed are key factors to future-proof your business.

        [/text][text]Deepak Mittal
        Founder and CEO
        [/text][text]

        Image Source- Forbes

        [/text][image float=”center” lightbox=”” width=”” is_gallert_item=”” src=”11378″ alt=”” href=”” title=”” popup_content=”” id=”” class=”” style=””][custom_heading id=”” class=”” style=””]

        13 Practices To Keep Remote Teams Running Smoothly

        [/custom_heading][divider direction=”start” icon_fontawesome=”” style=”” id=”” class=””][text]The coronavirus pandemic forced businesses around the globe to shut down in-person operations. As a result, many traditional companies and industries were unexpectedly thrust into the unfamiliar territory of managing a remote workforce.

        While some have returned to a degree of onsite work, many continue to offer partial or full-time remote work. This presents unique challenges to keeping a team organized and productive, but these difficulties can be overcome with the right strategies in place.

        Below, the members of Forbes Business Council share 13 best practices for keeping things running smoothly while managing your remote staff and contractors.[/text][link target=”blank” lightbox=”” href=”https://www.forbes.com/sites/forbesbusinesscouncil/2020/09/30/13-practices-to-keep-remote-teams-running-smoothly/#48e514702d50″ title=”” popup_content=”” id=”” class=”” style=””]Click Here to read the full article[/link]

        Inside Case Study

        Predictions 2022: 5 Potential Trends in Health Care 4.0
        [clear by=”60px” id=”” class=””][text]

        Digital HealthHealthcare, Telemedicine

        [/text][custom_heading id=”” class=”” style=””]

        What is Lorem Ipsum and why is it used?

        [/custom_heading][share facebook=”true” twitter=”true” linkedin=”true” email=”true” size=”small” id=”” class=”” style=”margin-top: 10px;”][clear by=”15px” id=”” class=””][text]

        Lorem Ipsum, sometimes referred to as ‘lipsum’, is the placeholder text used in design when creating content. It helps designers plan out where the content will sit, without needing to wait for the content to be written and approved. .

        [/text]

        [image lightbox=”” width=”” is_gallert_item=”” src=”14628″ alt=”” href=”” title=”” popup_content=”” id=”” class=”” style=””]
        [custom_heading id=”” class=”” style=””]

        1. About the client

        [/custom_heading][text]

        Lorem Ipsum was originally taken from a Latin text by the Roman philosopher Cicero. But it has gone through significant changes over the centuries, with words being taken out, shortened, and added in. The word ‘lorem’, for example, isn’t a real Latin word, it’s a shortened version of the word ‘dolorem’, meaning pain.

        [/text]

        [custom_heading id=”” class=”” style=”margin-bottom: 0px;”]Why do we use Lorem Ipsum?[/custom_heading][text]Lorem ipsum dolor sit amet, consectetur adipiscing elit, sed do eiusmod tempor incididunt ut labore et dolore magna aliqua. Ut enim ad minim veniam, quis nostrud exercitation ullamco laboris nisi ut aliquip ex ea commodo consequat. Duis aute irure dolor in reprehenderit in voluptate velit esse cillum dolore eu fugiat nulla pariatur. Excepteur sint occaecat cupidatat non proident, sunt in culpa qui officia deserunt mollit anim id est laborum.[/text]
        [clear by=”60px” id=”” class=””][text]

        What We Think

        [/text]

        [text]

        AI Driving 2022 Future Business Trends

        The role of AI in work life and business is undisputed. As we move forward, this role will only expand to include more functionalities and use cases like artificial intelligence, machine learning, and data processing becomes more advanced and efficient. In the past few years alone, we’ve seen AI grow by leaps and bounds and this growth shows no signs of slowing down just yet.

        Read More >>[/text]

        [clear by=”60px” id=”” class=””]

        7 steps of image pre-processing to improve OCR using Python

        7 steps of image pre-processing to improve OCR using Python
        [clear by=”” id=”” class=”seven_step_heading_dima_clear_item1″][text]

        ML, Data + AI + Analytics

        [/text][custom_heading level=”h2″ id=”” class=”” style=””]

        7 steps of image pre-processing to improve OCR using Python

        [/custom_heading][share facebook=”true” twitter=”true” linkedin=”true” email=”true” size=”small” id=”” class=”” style=”margin-top: 10px;”][clear by=”15px” id=”” class=””]

        [image lightbox=”” width=”” is_gallert_item=”” src=”14865″ alt=”” href=”” title=”” popup_content=”” id=”” class=”” style=””]
        [custom_heading level=”h2″ id=”” class=”” style=”margin-bottom: 0px;”]

        What is OCR?

        [/custom_heading][text]Optical Character Recognition (OCR) is a course of perceiving text inside pictures and changing it into an electronic structure. These pictures could be of manually written text, printed text like records, receipts, name cards, and so forth, or even a characteristic scene photo. OCR uses two techniques together to extract text from any image. First, it must do text detection to determine where the text resides in the image. In the second technique, OCR recognizes and extracts the text using text recognition techniques. OCR is an active research area and with the introduction of deep learning, the performance of various OCR models has been increased sufficiently. [/text]

        [clear by=”15px” id=”” class=””]
        [custom_heading level=”h2″ id=”” class=”” style=”margin-bottom: 0px;”]

        What are the application areas for OCR?

        [/custom_heading][text]OCR has many application areas in the real world and one particularly important benefit is to minimize the human effort across various industries in our everyday life. Some of the popular application areas for OCR are the digitization of various paperwork, book scanning, reading signboards to translate into various languages, reading signboards for self-driving cars, registration number extraction from vehicle’s number plate, and handwritten recognition tasks, etc,[/text][clear by=”15px” id=”” class=””]

        [custom_heading level=”h2″ id=”” class=”” style=”margin-bottom: 0px;”]

        Why does the image pre-processing important for any OCR model’s performance?

        [/custom_heading]

        [text]OCR has many application areas in the real world and one particularly important benefit is to minimize the human effort across various industries in our everyday life. Some of the popular application areas for OCR are the digitization of various paperwork, book scanning, reading signboards to translate into various languages, reading signboards for self-driving cars, registration number extraction from vehicle’s number plate, and handwritten recognition tasks, etc,

        We have consolidated seven useful steps for pre-processing the image before providing it to OCR for text extraction. Explain these pre-processing steps, we are going to use OpenCV and Pillow library.[/text]

        [image lightbox=”” width=”” is_gallert_item=”” src=”15240″ alt=”” href=”” title=”” popup_content=”” id=”” class=”” style=””]
        [clear by=”35px” id=”” class=””][custom_heading level=”h2″ id=”” class=”” style=”margin-bottom: 0px;”]

        Installing required software for OCR pre-processing

        [/custom_heading]

        [text]Install OpenCV and Pillow Library:

        • Install the main module of OpenCV using pip command

                pip install OpenCV-python

        • Or you can Install the full package of OpenCV using pip command

                pip install OpenCV-contrib-python

        • Install Pillow library using pip command

                pip install pillow

        • Import the OpenCV in the code as given below

                import cv2

        [/text]

        [clear by=”25px” id=”” class=””]
        [clear by=”15px” id=”” class=””][custom_heading level=”h2″ id=”” class=”” style=”margin-bottom: 0px;”]

        Seven steps to perform image pre-processing for OCR

        [/custom_heading][clear by=”15px” id=”” class=””][image lightbox=”” width=”” is_gallert_item=”” src=”15234″ alt=”” href=”” title=”” popup_content=”” id=”” class=”” style=””][clear by=”35px” id=”” class=””]

        [clear by=”15px” id=”” class=””][custom_heading level=”h3″ id=”” class=”” style=”margin-bottom: 0px;”]

        1. Normalization

        [/custom_heading][text]This process changes the range of pixel intensity values. The purpose of performing normalization is to bring image to range that is normal to sense. OpenCV uses normalize () function for the image normalization.[/text][text]

        norm_img = np.zeros((img.shape[0], img.shape[1]))
        img = cv2.normalize(img, norm_img, 0, 255, cv2.NORM_MINMAX)

        [/text]

        [clear by=”15px” id=”” class=””][custom_heading level=”h3″ id=”” class=”” style=”margin-bottom: 0px;”]

        2. Skew Correction

        [/custom_heading][text]While scanning or taking a picture of any document, it is possible that the scanned or captured image might be slightly skewed sometimes. For the better performance of the OCR, it is good to determine the skewness in image and correct it.[/text][text]

        def deskew(image):

        co_ords = np.column_stack(np.where(image > 0))

        angle = cv2.minAreaRect(co_ords)[-1]

        if angle < -45:

        angle = -(90 + angle)

        else:

        angle = -angle

        (h, w) = image.shape[:2]

        center = (w // 2, h // 2)

        M = cv2.getRotationMatrix2D(center, angle, 1.0)

        rotated = cv2.warpAffine(image, M, (w, h), flags=cv2.INTER_CUBIC,

        borderMode=cv2.BORDER_REPLICATE)

        return rotated

        [/text]

        [clear by=”25px” id=”” class=””][custom_heading level=”h3″ id=”” class=”” style=”margin-bottom: 0px;”]

        3. Image Scaling

        [/custom_heading][text]To achieve a better performance of OCR, the image should have more than 300 PPI (pixel per inch). So, if the image size is less than 300 PPI, we need to increase it. We can use the Pillow library for this.[/text][text]

        from PIL import Image

        def set_image_dpi(file_path):

        I’m = Image.open(file_path)

        length_x, width_y = im.size

        factor = min(1, float(1024.0 / length_x))

        size = int(factor * length_x), int(factor * width_y)

        im_resized = im.resize(size, Image.ANTIALIAS)

        temp_file = tempfile.NamedTemporaryFile(delete=False, suffix=’.png’)

        temp_filename = temp_file.name

        im_resized.save(temp_filename, dpi=(300, 300))

        return temp_filename

        [/text]

        [clear by=”25px” id=”” class=””][custom_heading level=”h3″ id=”” class=”” style=”margin-bottom: 0px;”]

        4. Noise Removal

        [/custom_heading][text]This step removes the small dots/patches which have high intensity compared to the rest of the image for smoothening of the image. OpenCV’s fast Nl Means Denoising Coloured function can do that easily.[/text][text]

        def remove_noise(image):

        return cv2.fastNlMeansDenoisingColored(image, None, 10, 10, 7, 15)

        [/text]

        [clear by=”25px” id=”” class=””][custom_heading level=”h3″ id=”” class=”” style=”margin-bottom: 0px;”]

        5. Thinning and Skeletonization

        [/custom_heading][text]This step is performed for the handwritten text, as different writers use different stroke widths to write. This step makes the width of strokes uniform. This can be done in OpenCV[/text][text]

        img = cv2.imread(‘j.png’,0)
        kernel = np.ones((5,5),np.uint8)
        erosion = cv2.erode(img, kernel, iterations = 1)

        [/text]

        [clear by=”10px” id=”” class=””][custom_heading level=”h3″ id=”” class=”” style=”margin-bottom: 0px;”]

        6. Gray Scale image

        [/custom_heading][text]This process converts an image from other color spaces to shades of Gray. The colour varies between complete black and complete white. OpenCV’s cvtColor() function perform this task very easily.[/text][text]

        def get_grayscale(image):

        return cv2.cvtColor(image, cv2.COLOR_BGR2GRAY)

        [/text]

        [clear by=”25px” id=”” class=””][custom_heading level=”h3″ id=”” class=”” style=”margin-bottom: 0px;”]

        7. Thresholding or Binarization

        [/custom_heading][text]This step converts any colored image into a binary image that contains only two colors black and white. It is done by fixing a threshold (normally half of the pixel range 0-255, i.e., 127). The pixel value having greater than the threshold is converted into a white pixel else into a black pixel. To determine the threshold value according to the image Otsu’s Binarization and Adaptive Binarization can be a better choice. In OpenCV, this can be done as given.[/text][text]

        def thresholding(image):

        return cv2.threshold(image, 0, 255, cv2.THRESH_BINARY +

        cv2.THRESH_OTSU)[1]

        [/text]

        [clear by=”40px” id=”” class=””][custom_heading level=”h2″ id=”” class=”” style=”margin-bottom: 0px;”]

        Conclusion:

        [/custom_heading][text]OCR has a wide range of application areas in the real world and improving the performance of OCR models is necessary to avoid the mistakes in the real world. Image pre-processing reduces the error by a significant margin and helps to perform OCR better. Image pre-processing steps can be decided based on the images available for text extraction. Based on the image, some steps can be removed, and some others can be added as per requirement. The pre-processing becomes more effective when applied after having a better understanding of the input data (images) and the task to perform.[/text][text]If you like the article, please let us know via your comments. If you are looking for help in NLP projects then schedule a discussion using the link or send an email to [email protected]
        https://calendly.com/nextgeninvent
        Follow us for more information: https://www.linkedin.com/company/nextgen-invent-corporation/
        [/text]

        [clear by=”40px” id=”” class=””]
        [clear by=”20px” id=”” class=””][text]

        Stay In the know

        Get latest updates and industry insights every month.

        [/text][clear by=”15px” id=”” class=””]